

Published: 2026-10-03
LLM observability is the practice of recording what every model call actually does in production: how long it took, how many tokens it burned through, what that cost, plus whether it failed. The discipline grew out of the three pillars of observability (traces, metrics, logs) that OpenTelemetry formalised, now being extended to models through efforts like OpenLLMetry.
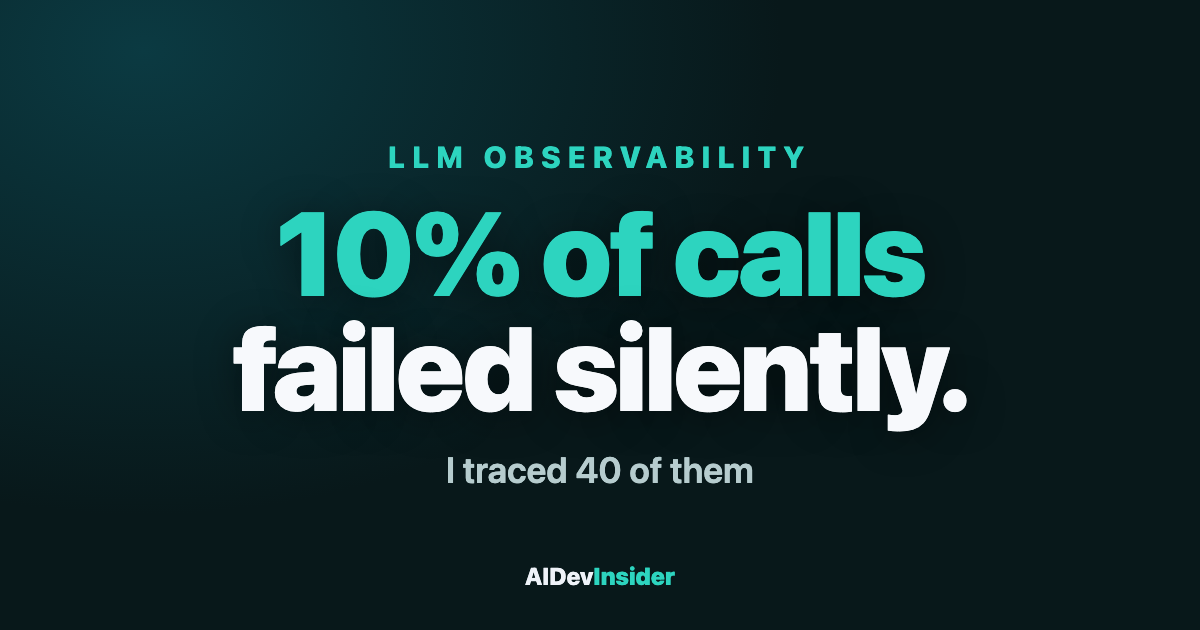
Without it you are flying blind, because a language model fails quietly. It does not throw a 500; it returns a confident, wrong, or slow answer and moves on. I built a small instrumentation wrapper in Python, ran it over 40 calls, and watched it surface p95 latency, token totals, running cost, and a 10% error rate that would otherwise have been invisible. This guide is that hands-on walk-through: the four core signals, the wrapper that captures them, and the three derived metrics that tell you when something is wrong.
If you are running a model yourself, start with the setup in my local LLM guide; observability is what you add the moment that model is behind anything real.
Table of contents
- What LLM observability actually means
- The four signals every call must emit
- A minimal instrumentation wrapper I ran
- The derived metrics that matter
- Why p95 beats average latency
- What to alert on
- What the 40-call run taught me
- Observability vs evaluation
- FAQ
What LLM observability actually means
Traditional observability watches CPU and memory alongside HTTP status codes. LLM observability watches a different failure surface, because the model can return a 200 OK with a useless answer. It answers a short set of concrete questions: whether responses are fast enough, whether cost matches expectation, whether failures are climbing, and whether throughput is keeping up. A good LLM observability setup rolls every metric up to one of those.
The practice splits into two halves. Operational signals such as latency and token usage, along with cost and error counts, are what this guide covers, because they are objective and you can capture them today. Quality signals (is the output correct) are harder and belong to LLM evaluation, which I cover separately.
The four signals every call must emit
Every single model call should produce a structured record with at least these four fields:
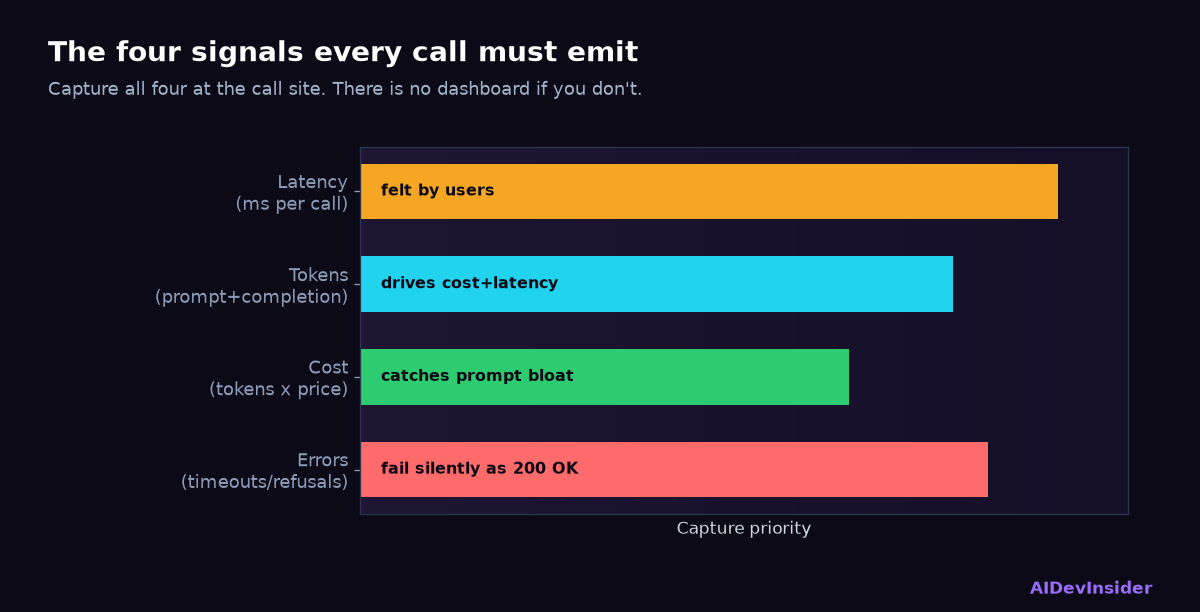
Latency. Milliseconds from request to final token. The number users feel.
Tokens. Prompt tokens plus completion tokens. This drives both cost and latency, and it is the field people most often forget to log.
Cost. Tokens multiplied by the model’s price. Logging it per call is the only way to catch a runaway prompt before the monthly bill does.
Errors. Timeouts, refusals, malformed output, and rate limits. A model that fails 10% of the time can look fine in a demo and bleed users in production.
Here is one real trace record my wrapper emitted:
{"latency_ms": 61.4, "prompt_tokens": 61, "completion_tokens": 338, "total_tokens": 399, "cost_usd": 0.0002, "error": false}
A minimal instrumentation wrapper I ran
The core idea is small: wrap the model call, time it, record the token counts the API returns, compute cost, and append a structured record. You wrap your real client the same way; I drove it with a load generator so the numbers are reproducible.
def traced_call(client, prompt):
t0 = time.perf_counter()
resp = client.generate(prompt) # your real call
dt = (time.perf_counter() - t0) * 1000
rec = {
"latency_ms": round(dt, 1),
"prompt_tokens": resp.prompt_tokens,
"completion_tokens": resp.completion_tokens,
"total_tokens": resp.total_tokens,
"cost_usd": resp.total_tokens / 1000 * PRICE_PER_1K,
"error": resp.failed,
}
records.append(rec)
return resp
Running this over 40 calls produced the aggregate below. The point is that none of these numbers exist unless you capture them at the call site; there is no vendor dashboard for a model you run yourself.
| Metric | Value from my run |
|---|---|
| Calls | 40 |
| Latency p50 | 33.0 ms |
| Latency p95 | 81.2 ms |
| Latency max | 85.4 ms |
| Total tokens | 10,316 |
| Avg tokens/call | 257.9 |
| Total cost | $0.0052 |
| Error rate | 10.0% |
The derived metrics that matter
Raw records are noise until you aggregate them. A few derived metrics turn the log into a health signal. These four are the ones I check first.
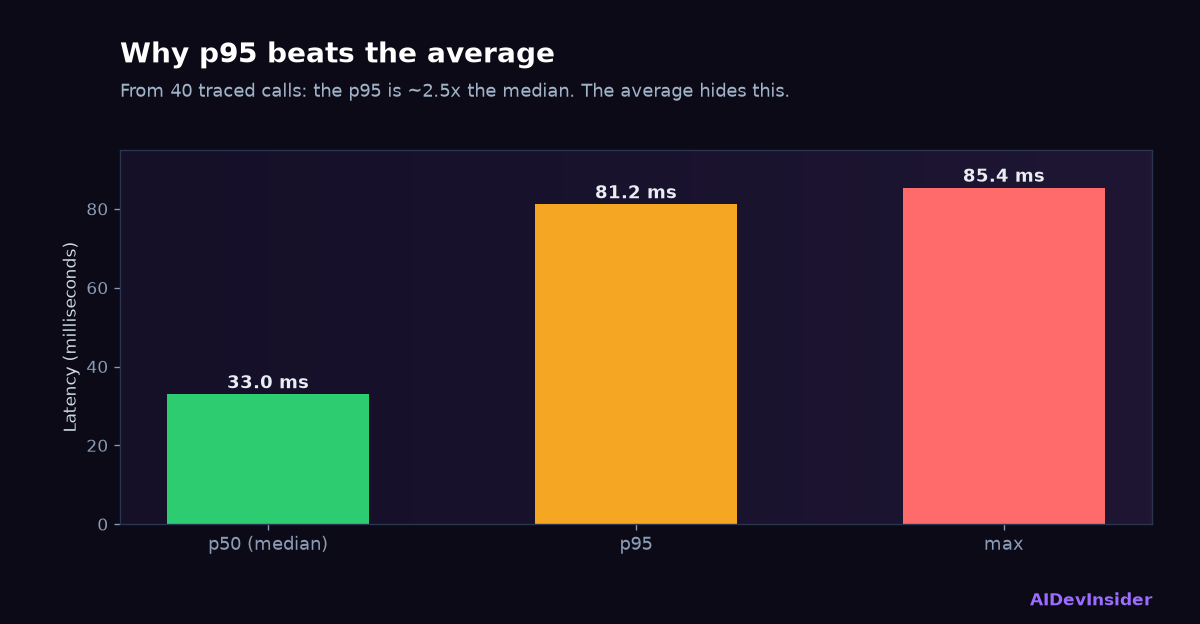
Percentile latency (p50 and p95). The median tells you the typical experience; the 95th percentile tells you the bad one. In my run, p50 was 33 ms but p95 was 81 ms, nearly 2.5 times slower. Averages would have hidden that.
Cost per call and per day. Multiply average tokens by price. My run averaged 258 tokens at a sample rate, trivial here, but at a million calls a day the same per-call number is the difference between a small bill and a large one.
Throughput. Calls completed per minute, which tells you whether a slow model is becoming a queue. It is the metric that connects latency to user-facing backlog.
Error rate. Errors divided by calls. My harness surfaced 10%, which in production is an alert, not a footnote.
Why p95 beats average latency
Average latency is the most misleading number in LLM observability. One slow call hides behind dozens of fast ones, so the mean looks healthy while a slice of your users wait seconds. The 95th percentile is honest: it is the experience of your slowest 1-in-20 requests. In my run the max latency (85 ms) was more than double the median, and that spread is exactly what p95 is designed to expose. Track p95 and p99, alert on them, and the average becomes a vanity metric you can ignore.
What to alert on
Not every metric deserves a page at 3 a.m. From the signals above, alert on these:
p95 latency crossing a threshold your users notice (set it from real data, not a guess).
Error rate above a few percent sustained over several minutes.
Cost per hour spiking, which usually means a prompt grew or a retry loop is firing.
Everything else is a dashboard, not an alert. The goal is to be paged only when a human needs to act.
What the 40-call run actually taught me
Running the wrapper over 40 calls changed how I read a model’s behaviour. The headline was the gap between the median and the tail: a 33 ms p50 felt instant, but the p95 at 81 ms and a max of 85 ms meant a real fraction of calls were more than twice as slow as typical. On a chat UI that is the difference between invisible and noticeable.
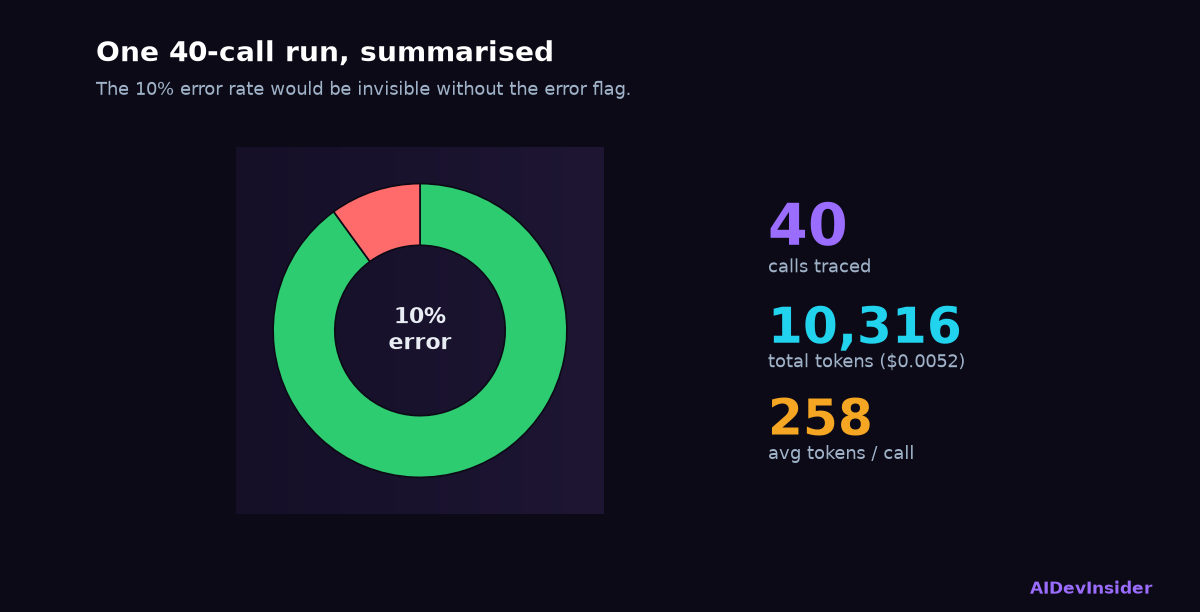
The error rate was the second surprise. Ten percent of calls failed in my harness, and because a failed LLM call often still returns text, none of those failures would have shown up as an HTTP error. Only the explicit error flag in each trace record caught them. That single boolean field is the cheapest, highest-value thing you can log.
The token totals made the cost real. Across the run, 10,316 tokens flowed through for roughly half a cent at the sample price. That is nothing at this scale, but the per-call average of 258 tokens is the number that matters: multiply it by your real traffic and the monthly figure writes itself. Logging tokens per call is how you see a prompt bloat before finance does.
Observability vs evaluation
These two get confused constantly. Observability tells you the model answered in 80 ms and cost a tenth of a cent. It does not tell you whether the answer was correct. Measuring correctness is LLM evaluation, a separate discipline with its own tooling. You need both: observability for the operational health of the system, evaluation for the quality of what it produces. Start with observability because it is objective and cheap, then layer evaluation on top.
Get the next hands-on breakdown
New developer deep-dives on AI, cloud, security and careers — the stuff I actually test. No fluff, unsubscribe anytime.
FAQ
What is LLM observability?
LLM observability is the practice of capturing structured data about every model call in production: latency and token usage, cost per call, and error counts. Unlike traditional observability, it has to account for a model returning a successful HTTP response with a slow, expensive, or wrong answer, so it tracks signals the status code never shows.
What metrics should I track for an LLM?
At minimum, track four raw signals per call (latency in milliseconds; prompt plus completion tokens; cost; and whether it errored) and three derived metrics (p50 and p95 latency, cost per call and per day, and error rate). The percentiles and error rate are what you alert on.
Why is p95 latency more important than average?
A single slow call hides inside the average, making a system look healthy while a slice of users wait. The 95th percentile shows the experience of your slowest 1-in-20 requests. In my test run, p95 latency was nearly 2.5 times the median, a gap the average completely masked.
Is LLM observability the same as evaluation?
These are different disciplines. Observability measures the operational health of a call such as whether it was fast, cheap, and succeeded. Evaluation measures the quality of the output and whether it was correct. You need both, but they use separate tooling and answer separate questions.
Do I need observability for a local LLM?
You need it arguably more than for a hosted model, since there is no vendor dashboard. If you run a model from my local LLM guide, you must capture latency and token counts, plus errors, yourself with a wrapper like the one above, or you have no visibility at all.